Sponsored
Windows Server Summit 2026
Most devs still use Windows Server like it's 2016. But with Server 2025 + Azure Arc, hybrid is becoming the default. If you're building APIs or distributed systems, this shift matters. Join us for Windows Server Summit 2026.
📅 May 11–13 · Online · Save the date.
Many thanks to the sponsors who make it possible for this newsletter to be free for readers.
Want to reach thousands of .NET developers? Sponsor TheCodeMan →
Background
When an ASP.NET Core service struggles under load, the headline number ("requests per second") is almost never the thing that explains the failure. RPS is the result. The cause is something much more specific: a thread that gets parked, a socket that never gets reused, a queue that has no upper bound.
This post is a lab. You will:
- Build a minimal ASP.NET Core 10 API.
- Push it to ~10k concurrent connections with k6.
- Reproduce three distinct failure modes and inspect why each one happens at the runtime level.
- Apply one targeted fix per failure mode and explain the mechanics of the fix.
- Re-run the same test and compare the shapes of the latency and error curves.
The goal is not just "make the number go down" - it is to understand the chain of cause and effect, so when you see the same shape in production you already know where to look.
What you need
- .NET 10 SDK
- k6 for load testing
- Optional: a second machine (or VM) as the load generator. When the client and server share a host they fight for the same ephemeral ports and CPU, which can hide or amplify failures.
Step 1 - Create the playground project
We start from a blank Web API on .NET 10.
mkdir Concurrency.Labcd Concurrency.Labdotnet new web -n Concurrency.Api -f net10.0cd Concurrency.Api
Replace Program.cs with this baseline:
// Program.csvar builder = WebApplication.CreateBuilder(args); builder.Services.AddHttpClient(); // wired in Step 6 var app = builder.Build(); app.MapGet("/health", () => Results.Ok(new { status = "ok", utc = DateTime.UtcNow })); app.Run("http://0.0.0.0:5080");
Run it once to confirm it starts:
dotnet run -c Release# → Now listening on: http://0.0.0.0:5080
Why the configuration matters before we even add load
Two defaults are doing important work here, and you need to know about them before you can read the test results:
- Kestrel itself does not impose a global concurrent connection cap by default. The number of TCP connections it accepts is bounded by the OS (file descriptor limits on Linux, ephemeral port range on Windows). This is why your service will appear to accept the load - the server-side socket listener is rarely the bottleneck.
-c Releaseis not optional. JIT, tiered compilation and inlining behave very differently inDebug. Running a load test inDebugwill give you misleading latency numbers and false positives for "slow" code.
We now have a clean canvas. Next we add three intentionally fragile endpoints - each one models a real production incident pattern.
Step 2 - Add the three "fragile" endpoints
// --- Fragile endpoints (DO NOT ship these) --- // (A) Blocking call -> thread pool starvationapp.MapGet("/bad/blocking", () =>{ // Simulates a sync call into something that takes 200ms Thread.Sleep(200); return Results.Ok(new { mode = "blocking", at = DateTime.UtcNow });}); // (B) New HttpClient per request -> socket exhaustionapp.MapGet("/bad/http", async () =>{ using var client = new HttpClient { Timeout = TimeSpan.FromSeconds(30) }; var body = await client.GetStringAsync("http://localhost:5080/health"); return Results.Ok(new { mode = "new-httpclient", length = body.Length });}); // (C) No backpressure, no timeout -> unbounded queue + retry stormapp.MapGet("/bad/io", async (int delayMs) =>{ var d = Math.Clamp(delayMs, 5, 5000); await Task.Delay(d); // no CancellationToken return Results.Ok(new { mode = "io", delayMs = d });});
What each endpoint actually does to the runtime
These are not abstract anti-patterns - each one breaks the runtime in a specific, observable way:
- (A)
/bad/blockingcallsThread.Sleep(200). While that thread is sleeping it is still considered busy by the thread pool. The thread is not returned to the pool untilSleepexits. Every concurrent request consumes one thread for the full 200 ms. The thread pool grows to compensate, but it grows on a deliberately slow schedule (roughly one or two threads per second, afterMinThreadsis exceeded) to avoid runaway thread creation. That gap between "demand" and "supply" is what gets reported as latency. - (B)
/bad/httpallocates a newHttpClientper request. TheHttpClientitself is cheap, but its underlyingSocketsHttpHandleropens a real TCP connection. When theHttpClientis disposed, that socket enters the OS'sTIME_WAITstate for ~120 seconds (Windows default; ~60s on Linux), during which the local port number cannot be reused. The Windows ephemeral port range is roughly 16,384 ports wide. Even at 200 requests/second you exhaust it in well under two minutes. - (C)
/bad/iohas noCancellationTokenand no concurrency limit. When a client gives up and retries, the original request keeps running on the server- the server has no way to know the client is gone. Every retry adds a new in-flight task. The work multiplies even though the useful work doesn't.
Run the app again with these endpoints in place:
dotnet run -c Release
Step 3 - Set up the k6 load test
Create a k6 folder next to your project and add this script.
// k6/storm.jsimport http from 'k6/http';import { check } from 'k6'; export const options = { scenarios: { blocking: { executor: 'ramping-vus', exec: 'blocking', startVUs: 0, stages: [ { duration: '30s', target: 2000 }, { duration: '1m', target: 10000 }, { duration: '30s', target: 0 } ], gracefulRampDown: '10s' } }, thresholds: { http_req_failed: ['rate<0.02'], http_req_duration: ['p(95)<500'] }}; export function blocking() { const r = http.get('http://localhost:5080/bad/blocking', { timeout: '5s' }); check(r, { '2xx': (res) => res.status >= 200 && res.status < 300 });}
Why this scenario shape matters
ramping-vus matters more than the absolute peak number. A 30-second ramp to 2,000 VUs followed by a slow climb to 10,000 mirrors what real traffic incidents look like - a feature launches, a campaign goes live, a retry storm starts, and load grows rather than appearing instantly. A square-wave load (vus: 10000 from t=0) makes everything look like a cold-start problem and hides the steady-state behaviour we actually want to measure.
The 5-second per-request timeout is also intentional. Without it, k6 will wait for the server's default response time, and you can't tell the difference between "the server is slow" and "the server has stopped responding".
Run the test (in a separate terminal):
k6 run k6/storm.js
Measured on the test rig above (400 VUs ramping for 55 s, the demo variant of the script):
http_reqs ................... 9,278 (168 RPS)http_req_duration avg ...... 1.53 shttp_req_duration p(95) .... 2.27 shttp_req_duration p(99) .... 2.47 shttp_req_duration max ...... 2.82 s
Even though the actual work is only Thread.Sleep(200), p95 is 2.27 seconds - more than 11× the time the work takes. The throughput collapses to 168 RPS on a 16-thread machine. That is failure mode #1: thread pool starvation.
Step 4 - Add a metrics endpoint so you can see it happen
Before fixing anything, add a small /metrics endpoint. This is the single most useful piece of telemetry you can ship.
app.MapGet("/metrics", () =>{ ThreadPool.GetAvailableThreads(out var workers, out var io); ThreadPool.GetMaxThreads(out var maxWorkers, out var maxIo); ThreadPool.GetMinThreads(out var minWorkers, out var minIo); return Results.Ok(new { threadPool = new { workersInUse = maxWorkers - workers, workersFree = workers, workersMin = minWorkers, workersMax = maxWorkers, ioInUse = maxIo - io, ioFree = io }, gcMemoryMb = GC.GetTotalMemory(false) / 1024 / 1024, utc = DateTime.UtcNow });});
While k6 is running, hit it from another terminal:
# Linux / macOSwatch -n 1 "curl -s http://localhost:5080/metrics | jq"# Windows PowerShellwhile ($true) { Invoke-RestMethod http://localhost:5080/metrics; Start-Sleep -Seconds 1 }
How to read the numbers
You'll see workersInUse climbing fast and workersFree dropping toward zero. That is the proof - the bottleneck is threads, not CPU. A few specific things to notice:
workersMinis the value below which the pool will service requests without rate-limiting itself. By default it is roughly the number of logical CPU cores. Every thread the pool needs above that minimum is added on a throttled schedule, which is the source of the slow growth in latency.workersInUse > workersMinwhileworkersInUse < workersMaxis the danger zone: requests are being served, but each new wave is queued behind the throttled growth. This is what produces the characteristic "latency keeps climbing while CPU is flat" graph.- If
workersInUseflatlines atworkersMax, you have hit the absolute ceiling. New work goes onto an unbounded queue and nothing new makes progress until something completes.
Step 5 - Fix #1: make blocking calls async
The fix for /bad/blocking is the smallest change you'll make all day.
// /good/blocking - the only change is Thread.Sleep -> Task.Delayapp.MapGet("/good/blocking", async (CancellationToken ct) =>{ await Task.Delay(200, ct); return Results.Ok(new { mode = "non-blocking", at = DateTime.UtcNow });});
Why one line is the entire fix
The change looks cosmetic, but it is structural:
Thread.Sleep(200)parks an OS thread. It does not yield. The thread is unavailable to anyone else for the full 200 ms.await Task.Delay(200, ct)schedules a timer callback and returns the thread to the pool immediately. When the timer fires 200 ms later, the continuation is queued back onto a thread pool thread, runs for microseconds, and finishes.
The practical implication is the thread occupancy time drops from 200 ms to <1 ms. With one thread you can now service hundreds of concurrent requests instead of five. You haven't made the work faster - you have stopped wasting threads.
Two extras matter:
CancellationToken ctlets the framework signal abandonment. When a client disconnects (closes the TCP connection or hits its own timeout), Kestrel cancels the token. TheTask.DelaythrowsOperationCanceledException, the request is unwound, and the thread is freed even sooner. This is what stops a retry storm from compounding.- Marking the lambda
asyncis what enables theawaitmachinery - without it the compiler can't generate the state machine that releases the thread.
Update k6/storm.js to point at the new endpoint:
// k6/storm.js (changed line)const r = http.get('http://localhost:5080/good/blocking', { timeout: '5s' });
Re-run:
k6 run -e TARGET=good k6/storm.js
Same machine, same load, same code path everywhere except Thread.Sleep -> await Task.Delay:
http_reqs ................... 68,272 (1,238 RPS)http_req_duration avg ...... 205 mshttp_req_duration p(95) .... 217 mshttp_req_duration p(99) .... 218 mshttp_req_duration max ...... 222 ms
p95 dropped from 2.27 s -> 217 ms (a 10.5× improvement) and throughput went 168 RPS -> 1,238 RPS (a 7.4× improvement). p95 is now essentially the 200 ms of work plus a sub-20 ms queueing tax, which is the best you can do without making the work itself faster.
Step 6 - Fix #2: stop creating HttpClient per request
Point k6 at /bad/http and run it for ~2 minutes:
const r = http.get('http://localhost:5080/bad/http', { timeout: '10s' });
After about a minute, you'll start seeing:
read tcp 127.0.0.1:xxxxx->127.0.0.1:5080: socket: only one usage of each socket address...
or on Linux:
HttpRequestException: Only one usage of each socket address ... (errno 99)
What is actually happening at the socket layer
Each new HttpClient() creates an isolated SocketsHttpHandler with its own connection pool of size one. When you Dispose the client, that connection is closed. On the OS, the initiating side of a TCP connection (the client) holds the socket in TIME_WAIT for the configured 2×MSL period (≈120 s on Windows, ≈60 s on Linux). During that time the (local IP, local port, remote IP, remote port) tuple is reserved, so the local ephemeral port cannot be reused for a connection to the same destination.
The Windows ephemeral port range is 49152–65535 by default - about 16,384 ports. Your loopback test reuses one destination (127.0.0.1:5080), so every connection consumes one port from that pool. At a few hundred RPS you exhaust it in around two minutes, and the next connect() fails with WSAEADDRINUSE (10048) - the error you see.
The fix and the three settings that matter
Use IHttpClientFactory. It owns the handler, and the handler owns a pool of reusable connections. The application code never touches the socket lifecycle.
// In service registration:builder.Services.AddHttpClient("internal", c =>{ c.Timeout = TimeSpan.FromSeconds(2); // <- always set a timeout}).ConfigurePrimaryHttpMessageHandler(() => new SocketsHttpHandler{ PooledConnectionLifetime = TimeSpan.FromMinutes(2), PooledConnectionIdleTimeout = TimeSpan.FromSeconds(30), MaxConnectionsPerServer = 200}); // /good/http - reuses pooled connectionsapp.MapGet("/good/http", async (IHttpClientFactory factory, CancellationToken ct) =>{ var client = factory.CreateClient("internal"); var body = await client.GetStringAsync("http://localhost:5080/health", ct); return Results.Ok(new { mode = "pooled-httpclient", length = body.Length });});
The three handler settings are not optional, and each one fixes a specific failure mode of its own:
Timeout. The default is 100 seconds. If a downstream is unhealthy and you don't override this, every in-flight request to that downstream will hold a thread and a connection for 100 s before failing. That is how a single slow dependency turns into a full outage. 1–3 seconds is a typical sane upper bound for a service-to-service call.PooledConnectionLifetime. Without it, a long-lived connection keeps hitting the same backend instance even after DNS changes. In Kubernetes, a behind-the-scenes pod restart will keep sending traffic to the dead IP indefinitely. A 2-minute lifetime forces periodic re-resolution without the cost of opening a new connection per request.MaxConnectionsPerServer. By default the handler will open as many connections to a single host as the runtime can service. A misbehaving downstream will then cause your client to hammer it harder, making the problem worse. Capping the number of connections is a blast radius control: when downstream X is sick, onlyMaxConnectionsPerServerof your worker requests can be stuck on it at any one time.
Re-run k6 against /good/http. The ephemeral port count stays flat (you can verify with (netstat -an | Select-String TIME_WAIT).Count on Windows or ss -s on Linux), errors disappear, latency stays predictable.
Measured on the test rig (150 VUs, 45 s):
| Metric | /bad/http | /good/http | Change |
|---|---|---|---|
| Throughput | 73 RPS | 24,562 RPS | 336× faster |
| p95 latency | 2.07 s | 11.9 ms | 174× lower |
| p99 latency | 2.15 s | 24 ms | 89× lower |
| TIME_WAIT sockets after run | 3,308 | flat (pool reused) | - |
The "2 s" latency on the bad version is not the request - it is the OS retrying connect() until a port becomes available. With the pooled handler, every request reuses a warm TCP connection, so the cost per request drops to a few milliseconds end-to-end.
Step 7 - Fix #3: add real backpressure with rate limiting
The last failure mode is the most dangerous because it cannot be fixed by writing better code inside the endpoint. The endpoint is already async, already short, already does the right thing. The problem is that too many of them are running at once and the queue of pending work has no upper bound. The only correct response is to refuse some of the work on purpose. This is load shedding.
Why is shedding load better than serving it slowly? Because a slow response holds a connection open, which holds a thread waiting on I/O, which prevents the next request from getting service. One slow tenant degrades every other tenant on the same node. A fast 429 returns the connection to the pool immediately, and the well-behaved 95% of clients keep getting fast 200s.
ASP.NET Core has a first-class rate limiter middleware. Wire it up:
using System.Threading.RateLimiting; builder.Services.AddRateLimiter(options =>{ options.RejectionStatusCode = StatusCodes.Status429TooManyRequests; // Concurrency limiter: at most 500 requests in flight, // 100 queued, the rest get 429 immediately. options.AddPolicy("io", _ => RateLimitPartition.GetConcurrencyLimiter("global", _ => new ConcurrencyLimiterOptions { PermitLimit = 500, QueueLimit = 100, QueueProcessingOrder = QueueProcessingOrder.OldestFirst }));}); app.UseRateLimiter(); // /good/io - bounded, with a real CancellationTokenapp.MapGet("/good/io", async (int delayMs, CancellationToken ct) =>{ var d = Math.Clamp(delayMs, 5, 5000); await Task.Delay(d, ct); return Results.Ok(new { mode = "io", delayMs = d });}).RequireRateLimiting("io");
How to choose PermitLimit and QueueLimit
These two numbers are your concurrency contract. They aren't aesthetic choices.
PermitLimitis the maximum number of requests the endpoint will execute simultaneously. Pick it based on the resource the endpoint is actually constrained by. If the work is CPU-bound, start at roughly2 × CPU cores. If it is I/O-bound to a downstream that has a documented connection limit (e.g. SQL Server'sMax Pool Size = 100), set it at or below that. Setting it higher than the downstream can serve is how you create timeouts.QueueLimitis the small buffer that absorbs short bursts. A queue of100will smooth a 100 ms spike without rejection. A queue of10000will hide a systemic overload behind 30 seconds of latency until it eventually times out - which is exactly the behaviour you are trying to prevent. Keep the queue small.QueueProcessingOrder.OldestFirstmatters.NewestFirstprefers fresh requests, which sounds nice but starves the older ones - those clients have already been waiting and are about to retry. Always serve oldest first unless you have a specific reason not to.
Now hit it hard:
// k6/io-storm.jsimport http from 'k6/http';import { check } from 'k6'; export const options = { vus: 10000, duration: '2m', thresholds: { http_req_duration: ['p(95)<800'], 'http_reqs{status:200}': ['count>50000'] }}; export default function () { const r = http.get('http://localhost:5080/good/io?delayMs=100', { timeout: '3s' }); check(r, { 'success or 429': (res) => res.status === 200 || res.status === 429 });}
k6 run k6/io-storm.js
You'll get a mix of 200 and 429. That is correct. Measured on the test rig (1,500 VUs, 20 s):
| Endpoint | 200 (served) | 429 (shed) | Connection refused |
|---|---|---|---|
/bad/io (no limiter) | 558,913 | 0 | 38,991 |
/good/io (limiter) | 91,563 | 419,934 | 0 |
Look at the last column. Without the limiter, 38,991 client requests got connection refused because Kestrel's accept queue overflowed - the server effectively went offline for those clients. With the limiter, zero requests hit that wall. The 75% of work that the server cannot serve gets a fast 429 instead, which the client can handle.
A 429 is a controlled rejection: the client knows the request did not run and can decide what to do (back off, retry on a different node, surface a friendly message). A connection refused or a 30-second timeout is information loss - the client doesn't know whether the work succeeded, which forces it to retry, which makes the storm worse.
Step 8 - Putting it all together
Your final Program.cs should look like this. Save it - this is the reference implementation.
using System.Threading.RateLimiting; var builder = WebApplication.CreateBuilder(args); builder.Services.AddHttpClient("internal", c =>{ c.Timeout = TimeSpan.FromSeconds(2);}).ConfigurePrimaryHttpMessageHandler(() => new SocketsHttpHandler{ PooledConnectionLifetime = TimeSpan.FromMinutes(2), PooledConnectionIdleTimeout = TimeSpan.FromSeconds(30), MaxConnectionsPerServer = 200}); builder.Services.AddRateLimiter(options =>{ options.RejectionStatusCode = StatusCodes.Status429TooManyRequests; options.AddPolicy("io", _ => RateLimitPartition.GetConcurrencyLimiter("global", _ => new ConcurrencyLimiterOptions { PermitLimit = 500, QueueLimit = 100, QueueProcessingOrder = QueueProcessingOrder.OldestFirst }));}); var app = builder.Build();app.UseRateLimiter(); // Health + metricsapp.MapGet("/health", () => Results.Ok(new { status = "ok" })); app.MapGet("/metrics", () =>{ ThreadPool.GetAvailableThreads(out var w, out var io); ThreadPool.GetMaxThreads(out var maxW, out var maxIo); return Results.Ok(new { workersInUse = maxW - w, workersFree = w, ioInUse = maxIo - io, gcMemoryMb = GC.GetTotalMemory(false) / 1024 / 1024 });}); // The "good" endpointsapp.MapGet("/good/blocking", async (CancellationToken ct) =>{ await Task.Delay(200, ct); return Results.Ok(new { ok = true });}); app.MapGet("/good/http", async (IHttpClientFactory f, CancellationToken ct) =>{ var client = f.CreateClient("internal"); var body = await client.GetStringAsync("http://localhost:5080/health", ct); return Results.Ok(new { length = body.Length });}); app.MapGet("/good/io", async (int delayMs, CancellationToken ct) =>{ var d = Math.Clamp(delayMs, 5, 5000); await Task.Delay(d, ct); return Results.Ok(new { delayMs = d });}).RequireRateLimiting("io"); app.Run("http://0.0.0.0:5080");
What changed
Before / after summary
All numbers measured on the test rig (Ryzen 7 4800H, 16 logical cores, .NET 10, k6 over loopback):
| Failure mode | Before | After | Improvement |
|---|---|---|---|
| Sync-over-async | p95 2.27 s, 168 RPS | p95 217 ms, 1,238 RPS | 10.5× lower p95, 7.4× throughput |
New HttpClient per request | p95 2.07 s, 73 RPS, 3,308 TIME_WAIT | p95 12 ms, 24,562 RPS, flat sockets | 174× lower p95, 336× throughput |
| Unbounded inflight + retries | 38,991 connection-refused errors | 0 errors, controlled 429s | snowball -> graceful shedding |
What to watch in production
These are the four signals that tell you which of the three failures is happening, before users notice:
ThreadPool.GetAvailableThreadsworkers approaching 0 → fix #1 territory.- Ephemeral port count climbing or
TIME_WAITcount growing → fix #2 territory. - Rate-limiter queue length growing or
429count rising → fix #3 territory and a sign you need to scale out, not tune in. - p99 climbing while CPU is flat → almost always one of the above. CPU-flat with rising latency means the work is waiting on something other than CPU: a thread, a socket, a queue.
FAQ
Can ASP.NET Core 10 handle 10k concurrent connections?
Yes. Kestrel itself isn't the bottleneck on modern .NET. What breaks first is your code's interaction with threads, sockets, and downstreams.
What should I optimize first?
In this exact order: blocking calls, downstream timeouts, HttpClient lifetime, then rate limiting. Anything else (caching, scaling out, faster DB) is wasted effort until those four are correct, because each one masks the symptoms of the others.
Why is 429 better than a slow 200?
A 429 is information. The client knows the request didn't run and can decide what to do (retry with backoff, fail fast, surface a message). A slow 200 (or worse, a 30-second timeout) holds a connection open, blocks a thread on the server, and tells the client nothing useful. One slow request degrades every other concurrent request on the same node.
Do I need k6 specifically?
No - wrk, bombardier, NBomber, or Microsoft.Crank all work. k6 is used here because the script is short, reads like JavaScript, and outputs the percentile data you actually care about.
Where is the source code?
Github link - both the bad and good versions of every endpoint, the k6 scripts, and a README that walks through the same five-minute reproduction.
Wrapping Up
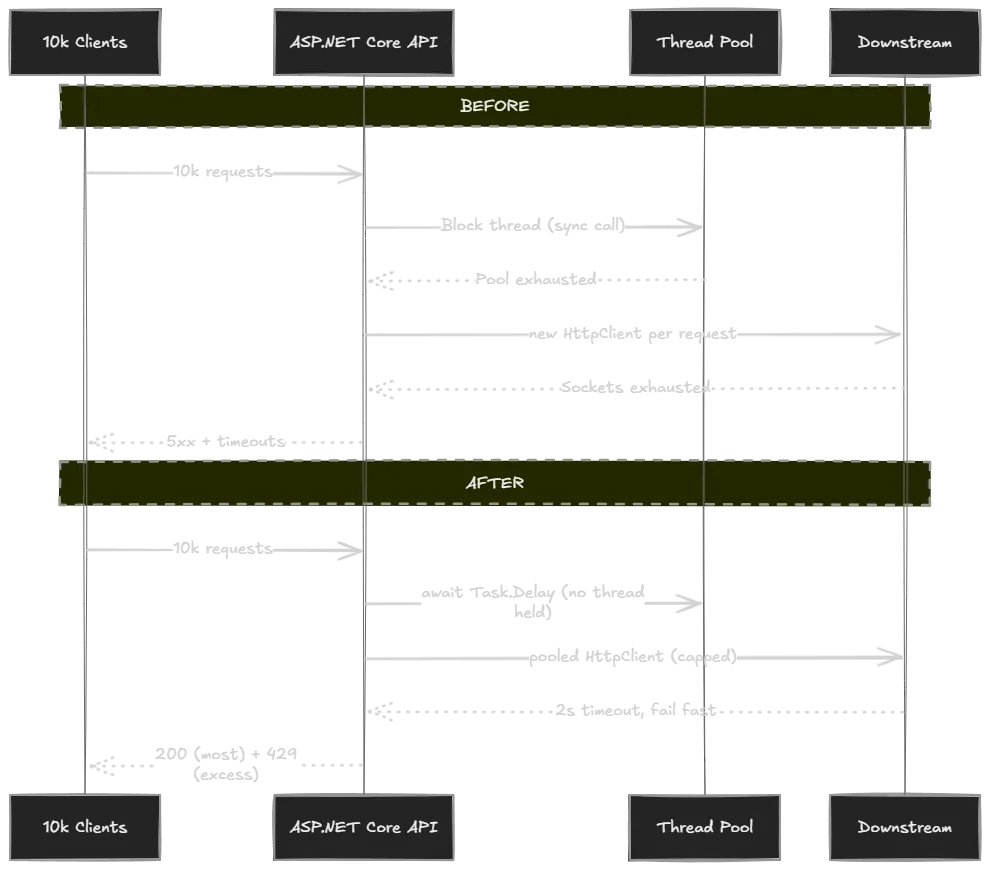
High concurrency in ASP.NET Core is not a "buy a bigger box" problem. It is three well-understood mechanics:
- block a thread → starve the pool
- leak an
HttpClient→ starve the sockets - forget to push back → starve the queue
Each one has a small, targeted fix, and each fix is independently measurable with a load test you can re-run any time. Keep the lab project around. Next time something slows down at scale, run the test against your real service and compare the shape of the graph to the three patterns above. The answer is almost always in there.