A quick word from me
This issue isn't sponsored - I write these deep dives in my free time and keep them free for everyone. If your company sells AI tools, dev tools, courses, or services that .NET developers would actually use, sponsoring an issue is the most direct way to reach them.
Want to reach thousands of .NET developers? Sponsor TheCodeMan →I want to show you the most practical AI tool I've built for my own .NET workflow.
Not a chatbot. Not a code generator. A performance lab where I describe what I want to test in plain English, and an AI agent runs the load tests, analyzes the results, detects problems, and suggests fixes - all from a chat conversation.
Here's what a real session looks like:
Me: Compare
http://localhost:5100/slow-thread-sleepwithhttp://localhost:5100/slow-task-delay- 15 seconds, 20 concurrent users.
Copilot:
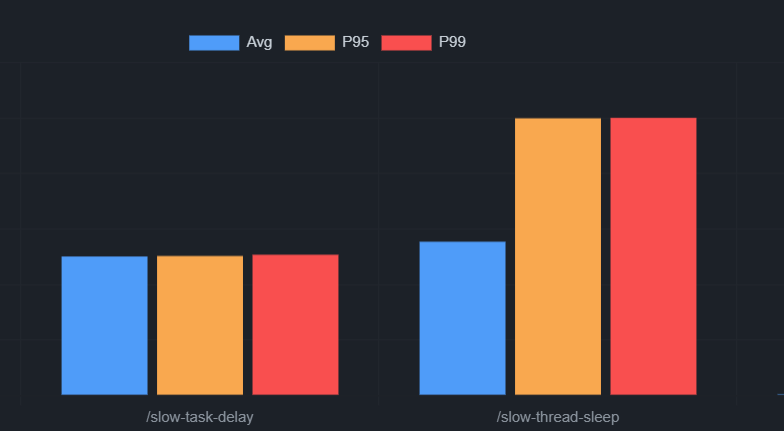
BASELINE → /slow-thread-sleep CANDIDATE → /slow-task-delay Throughput: 35.1 RPS → 39.9 RPS (✅ +13.5%)Average: 554ms → 501ms (✅ -9.6%)P95: 1000ms → 503ms (✅ -49.7%)P99: 1002ms → 507ms (✅ -49.3%) VERDICT: ✅ Candidate is faster
One message. Two real load tests against a live server. A side-by-side comparison with percentage deltas.
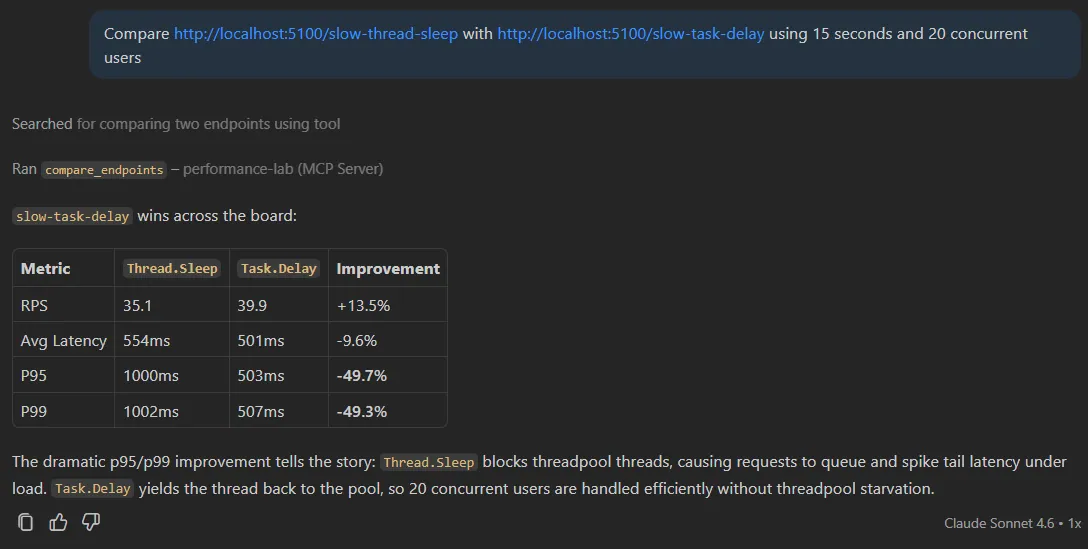
The p95/p99 improvement tells the whole story. Thread.Sleep holds a ThreadPool thread for 500ms. Under 20 concurrent users, threads run out and requests queue up. Tail latency explodes. Task.Delay releases the thread while waiting - same delay, completely different behavior under load.
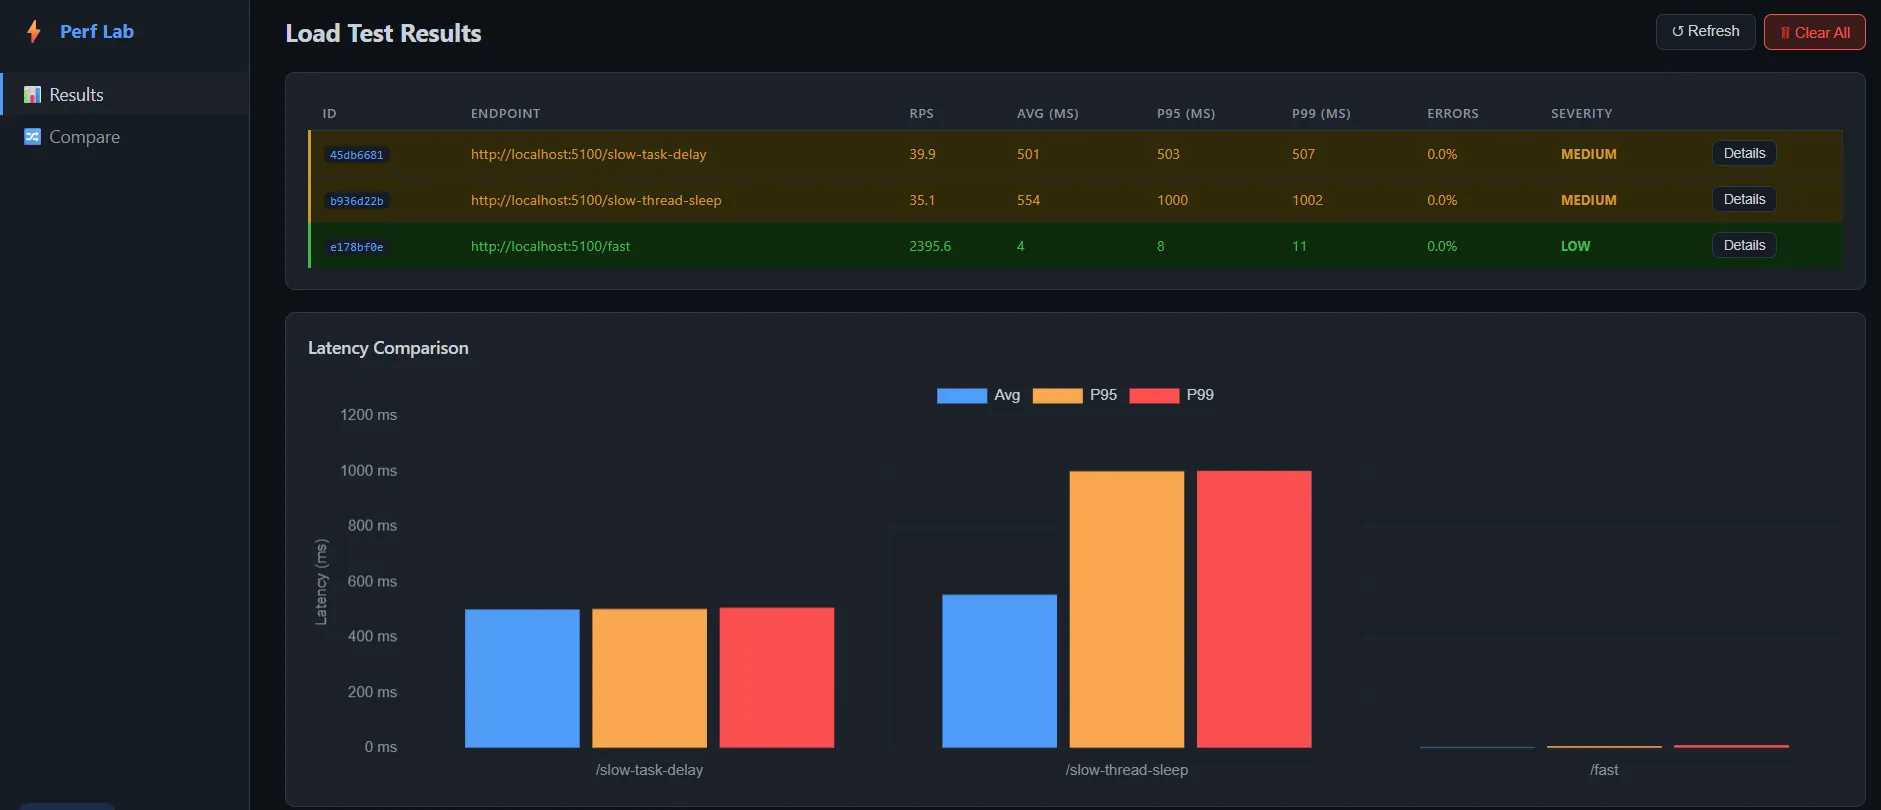
Also, I built the fronted Blazor dashboard to visualize all the results and comparisons. It's a plain REST client that talks to the same data store as the MCP server. The AI is the operator, the dashboard is the viewer.
Let me show you how this is built.
What Is MCP?
MCP (Model Context Protocol) is an open standard for giving AI tools explicit, callable functions.
Instead of the AI guessing, you expose tools like "run a load test" or "analyze these results." The AI becomes the orchestrator: it decides which tool to call, passes the right parameters, and reasons about the output.
This is different from one-off integrations. Build one MCP server, and any MCP-compatible client - GitHub Copilot, Claude Desktop, Cursor - connects to it without changes. One server, every AI tool.
Project Structure
Four projects, each with a clear job:
PerformanceLab.Api → port 5100 - sample API with intentional anti-patternsPerformanceLab.McpServer → port 5200 - MCP server + load test enginePerformanceLab.Dashboard → port 5300 - Blazor dashboard for visualizing resultsPerformanceLab.Shared - shared models
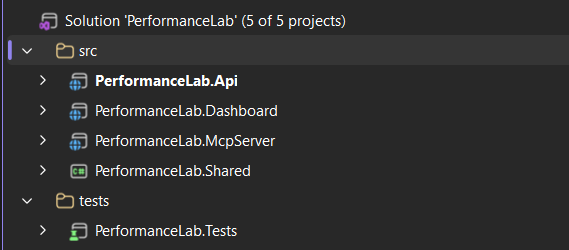
The key design decision: the dashboard and the MCP server share the same IResultStore, but are otherwise fully decoupled. The AI talks to /mcp. The dashboard reads from /api/results. Same data, different consumers.
Part 1: The API - Intentionally Broken
The PerformanceLab.Api project is a minimal ASP.NET Core API where every endpoint demonstrates a real performance anti-pattern. The goal is to have measurable targets.
Thread.Sleep vs Task.Delay
// ❌ Blocks a ThreadPool thread for the entire wait durationapp.MapGet("/slow-thread-sleep", (int ms = 500) =>{ Thread.Sleep(ms); return Results.Ok(new { message = "done", blockedMs = ms });}); // ✅ Releases the thread back to the pool while waitingapp.MapGet("/slow-task-delay", async (int ms = 500) =>{ await Task.Delay(ms); return Results.Ok(new { message = "done", waitedMs = ms });});
From the caller's perspective these look identical. Under load with 20 concurrent users they're worlds apart. Thread.Sleep holds a thread for 500ms. Once the ThreadPool runs out of threads, new requests queue up. Throughput collapses from thousands of RPS to dozens.
Sequential vs Parallel
// ❌ Five queries one after another - ~250ms totalapp.MapGet("/database-simulation", async () =>{ var results = new List<string>(); for (int i = 1; i <= 5; i++) { await Task.Delay(50); // simulate a DB query results.Add($"Record {i}"); } return Results.Ok(results);}); // ✅ All five queries at the same time - ~50ms totalapp.MapGet("/optimized-version", async () =>{ var tasks = Enumerable.Range(1, 5).Select(async i => { await Task.Delay(50); return $"Record {i}"; }); var results = await Task.WhenAll(tasks); return Results.Ok(results);});
The queries don't depend on each other's results. There's no reason to wait. Task.WhenAll gives a 5× latency reduction with one change.
There are also /memory-heavy (allocates large arrays to trigger GC pressure) and /cpu-heavy (SHA256 in a tight loop) endpoints. Each has a distinct signature the analyzer can detect.
Part 2: The MCP Server
The MCP server is a regular ASP.NET Core app. One NuGet package is all you need:
dotnet add package ModelContextProtocol.AspNetCore --version 0.3.0-preview.2
Program.cs
// Servicesbuilder.Services.AddSingleton<IResultStore, InMemoryResultStore>();builder.Services.AddScoped<LoadTestRunner>();builder.Services.AddScoped<ResultAnalyzer>(); // MCP - discovers all [McpServerTool] methods automaticallybuilder.Services .AddMcpServer() .WithHttpTransport() .WithToolsFromAssembly(); // CORS for the Blazor dashboardbuilder.Services.AddCors(opts => opts.AddPolicy("dashboard", policy => policy.WithOrigins("http://localhost:5300") .AllowAnyHeader().AllowAnyMethod())); var app = builder.Build();app.UseCors("dashboard"); app.MapMcp("/mcp"); // ← AI clients connect hereapp.MapGet("/api/results", (IResultStore store) => Results.Ok(store.GetAll())); // ← Dashboard reads here
That's the entire setup. WithToolsFromAssembly() scans for all [McpServerToolType] classes. You never register tools manually.
Part 3: Defining the Tools
Tools are C# methods with [McpServerTool] and [Description] attributes. The description is what the AI reads when deciding whether and how to call the tool.
[McpServerToolType]public sealed class PerformanceTools( LoadTestRunner runner, ResultAnalyzer analyzer, IResultStore store){ [McpServerTool(Name = "run_load_test")] [Description( "Run a load test against an API endpoint. Fires concurrent HTTP requests for the " + "specified duration and returns throughput, latency percentiles, and error rate. " + "Returns a result ID that can be passed to analyze_results or generate_report.")] public async Task<string> RunLoadTest( [Description("Full URL of the endpoint to test. Example: http://localhost:5100/fast")] string url, [Description("How many seconds the test should run. Default: 10")] int durationSeconds = 10, [Description("Number of virtual concurrent users (parallel HTTP connections). Default: 10")] int concurrentUsers = 10, CancellationToken cancellationToken = default) { var request = new LoadTestRequest { Url = url, DurationSeconds = durationSeconds, ConcurrentUsers = concurrentUsers, }; var result = await runner.RunAsync(request, cancellationToken); var analysis = analyzer.Analyze(result); store.Add(result, analysis); return FormatLoadTestResult(result, analysis); }
Two things matter here:
Descriptions are everything. The AI picks which tool to call entirely based on the description. Be explicit about what it does, what it returns, and what to do with the result.
Tools return strings. The AI reads plain text and reasons about it. No typed schema needed - just clear, consistent output.
The server exposes 10 tools in total: run_load_test, compare_endpoints, analyze_results, detect_slow_responses, detect_threadpool_starvation, detect_memory_pressure, list_results, compare_before_after, suggest_optimizations, and generate_report.
Part 4: The Load Test Runner
No k6, no JMeter, no external tools. Pure .NET:
public async Task<LoadTestResult> RunAsync(LoadTestRequest request, CancellationToken ct){ var records = new ConcurrentBag<RequestRecord>(); var endAt = DateTime.UtcNow.AddSeconds(request.DurationSeconds); using var linkedCts = CancellationTokenSource.CreateLinkedTokenSource(ct); linkedCts.CancelAfter(TimeSpan.FromSeconds(request.DurationSeconds + 15)); var workerTasks = Enumerable .Range(0, request.ConcurrentUsers) .Select(_ => RunWorkerAsync(request, records, endAt, linkedCts.Token)) .ToArray(); await Task.WhenAll(workerTasks); return BuildResult(request, [.. records]);}
Task.WhenAll spins up N concurrent workers - one per virtual user. Each worker fires requests in a tight loop until the time window closes. ConcurrentBag<RequestRecord> collects every result without locking.
One important HttpClient configuration detail:
builder.Services.AddHttpClient("loadtest", client =>{ client.Timeout = TimeSpan.FromSeconds(30);}).ConfigurePrimaryHttpMessageHandler(() => new HttpClientHandler{ AllowAutoRedirect = false, MaxConnectionsPerServer = 1000,});
MaxConnectionsPerServer = 1000 is critical. The default in older .NET versions is 2. Without this, the load test is bottlenecked by connection limits before it even reaches the server.
Part 5: The Rule-Based Analyzer
The analyzer is pure C# - no AI, no ML. It applies rules derived from real performance engineering and returns a severity rating with concrete recommendations.
public AnalysisResult Analyze(LoadTestResult result){ var issues = new List<string>(); var recommendations = new List<string>(); // ThreadPool starvation: p99 is 10× higher than p50 // Healthy APIs: p99/p50 ratio of 2–5 // Starved APIs: p99/p50 ratio of 20–100 if (result.P50Ms > 0 && result.P99Ms / result.P50Ms > 10) { var ratio = result.P99Ms / result.P50Ms; issues.Add( $"High latency variance - p99 is {ratio:F0}× higher than p50. " + "Classic ThreadPool starvation signature."); recommendations.Add( "Search for Thread.Sleep(), .Result, .Wait(), GetAwaiter().GetResult(). " + "Replace them all with async/await."); } // GC pause: one request was far slower than p99 if (result.MaxMs > result.P99Ms * 3) { issues.Add( $"Max ({result.MaxMs:F0}ms) is 3× higher than p99 ({result.P99Ms:F0}ms). " + "Suggests occasional GC pauses."); } // Low throughput with many users = severe blocking if (result.RequestsPerSecond < 5 && result.ConcurrentUsers >= 10) { issues.Add( $"Very low throughput: {result.RequestsPerSecond:F1} RPS with " + $"{result.ConcurrentUsers} concurrent users. Suggests severe blocking."); } return new AnalysisResult { Severity = DetermineSeverity(issues), Issues = issues, Recommendations = recommendations, };}
The AI wraps this with conversational context. It knows the URL, any code you've shown it, and results from previous runs in the same conversation. Rule-based detection plus AI reasoning is more useful than either alone.
Understanding the Numbers: p50, p95, p99
If percentile latency is new to you, here's the short version.
Sort 1,000 requests by response time:
- p50 (median): The 500th. Half your users are faster, half are slower.
- p95: The 950th. 1 in 20 users is slower than this.
- p99: The 990th. 1% of users experience this or worse.
A healthy API has p99 roughly 2–5× its p50. When p99 is 20–100× the p50, some requests are catastrophically slow - that's the ThreadPool starvation signature.
A concrete comparison from our endpoints:
/fast (healthy) - 10 users, 5 seconds RPS: 2,395.6 Average: 4ms P95: 8ms (~2× p50) P99: 12ms (~3× p50) ← healthy /slow-thread-sleep (starved) - 20 users, 15 seconds RPS: 35.1 ← collapsed Average: 554ms P95: 1000ms P99: 1002ms
The starvation is most visible in the throughput collapse (2,395 RPS → 35 RPS), not the p99/p50 ratio - because every request is equally stuck waiting for a thread.
Part 6: The Blazor Dashboard
The dashboard gives a visual overview of all stored test runs. It's a plain REST client - it polls /api/results and renders the data with Chart.js.
The Compare page puts two results side by side with percentage deltas.
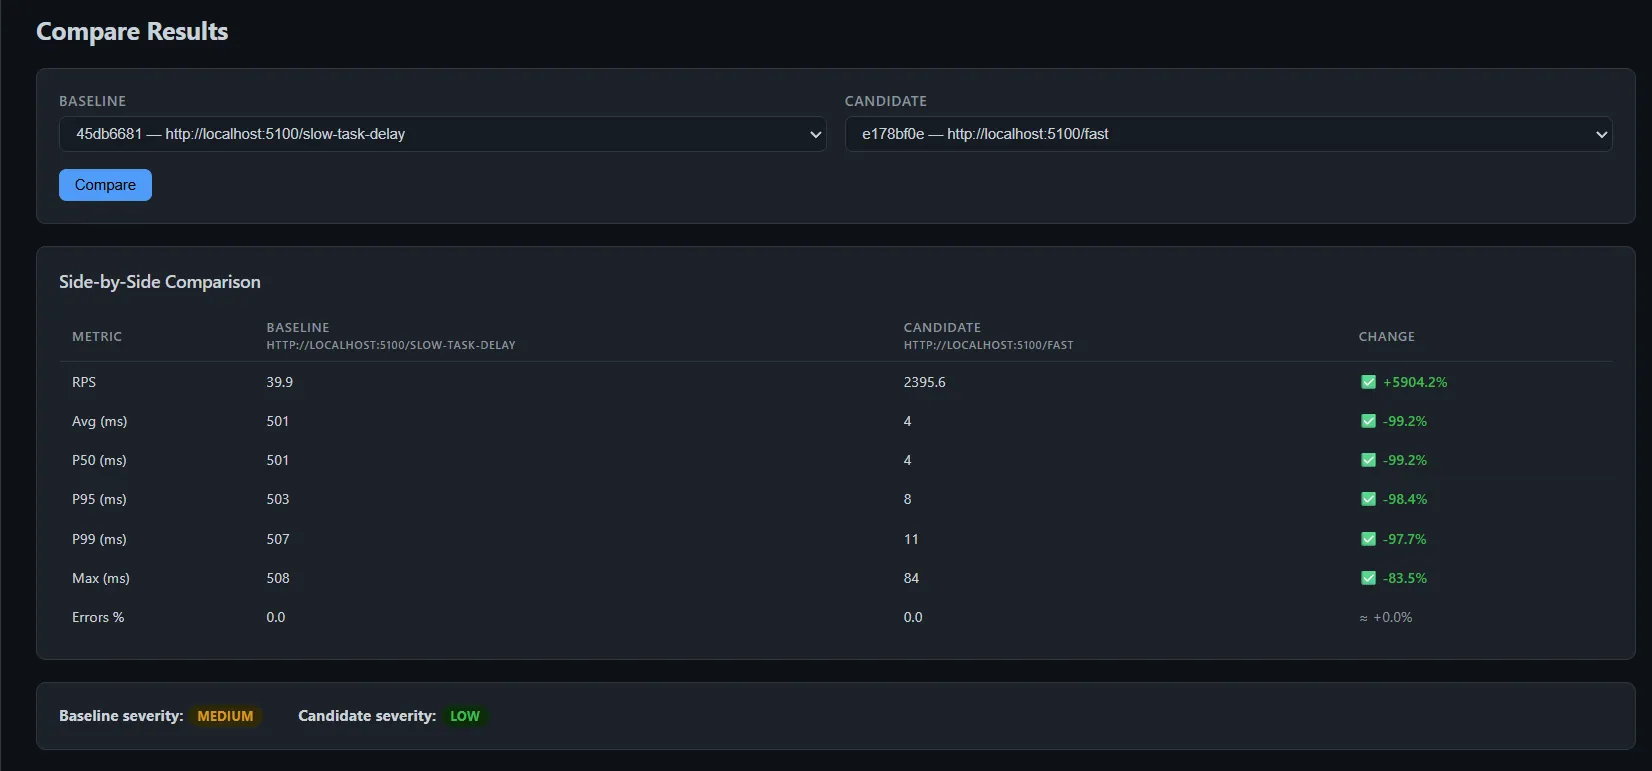
Nothing in the dashboard knows about MCP. That's intentional. The dashboard is a viewer. The AI is the operator.
Connecting to GitHub Copilot
Add .vscode/mcp.json to your workspace:
{ "servers": { "performance-lab": { "type": "http", "url": "http://localhost:5200/mcp" } }}
Start all three services, open Copilot in Agent mode, and start asking:
Run a load test against http://localhost:5100/fast for 5 seconds with 10 users
Compare http://localhost:5100/slow-thread-sleep with http://localhost:5100/slow-task-delayusing 15 seconds and 20 concurrent users
Detect threadpool starvation for result <ID>
Generate a full performance report for the last two runs
The AI understands context across multiple messages. After a comparison it can explain why one endpoint is faster, point at the specific line of code causing the problem, and suggest the fix - all in the same conversation.
The Broader Pattern
This project is a teaching tool. Every endpoint represents a real mistake I've seen in production .NET codebases. The analyzer's rules come from real performance investigations.
But the more important thing is the pattern:
Build domain-specific MCP tools around your existing services. The AI provides the reasoning layer; your tools provide grounded, real-world data.
Performance diagnosis is a perfect use case because the AI genuinely can't tell you what's slow in your specific API without real numbers. MCP gives it real numbers. The AI gives you context, explanation, and next steps.
You can apply the same pattern to:
- A deployment tool that queries your CI/CD pipeline
- A database tool that runs EXPLAIN on slow queries
- A metrics tool that reads from your Prometheus/Grafana stack
The MCP protocol is just HTTP + a schema. The value is entirely in what you expose.
The full project - all four services, 10 MCP tools, the Blazor dashboard, and 15 tests - is part of the AI in .NET Starter Kit.
Check out the previous articles in this series:
That's all from me today.
P.S. Follow me on YouTube.