Sponsored
- 🚀 Neon serverless Postgres is built for .NET Developers on Azure. Connect Neon to your apps using Npgsql or Entity Framework. Enable database branching, autoscaling, vector storage, and automate deployments with GitHub Actions. Start building now with Neon’s free plan. Start here!
- Level up your projects with FREE Clean Architecture template created by Milan Jovanovic, trusted by over 10,000 developers. Packed with features like CQRS, JWT authentication, Domain Events, and Docker support, it’s everything you need to start strong - download it now.
Many thanks to the sponsors who make it possible for this newsletter to be free for readers.
Want to reach thousands of .NET developers? Sponsor TheCodeMan →
The background
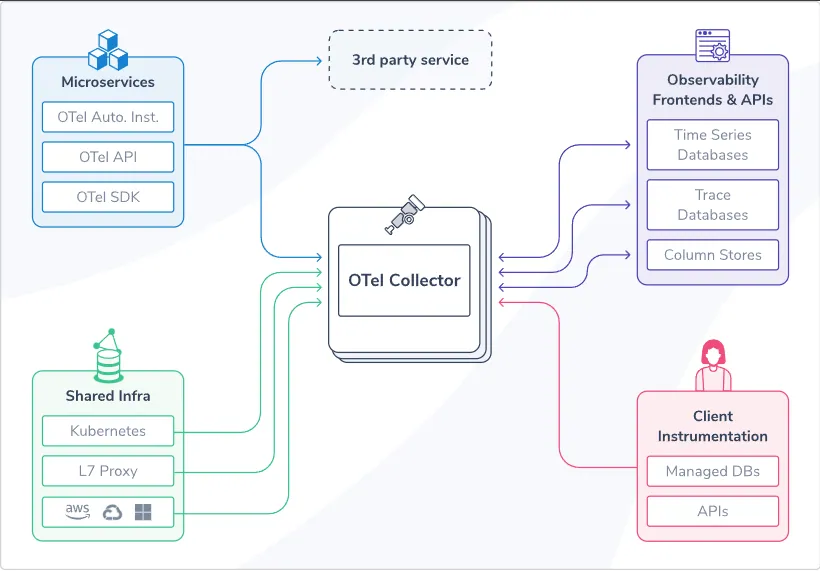
OpenTelemetry is an open-source framework for observability that provides tools, APIs, and SDKs to help developers generate, collect, and export telemetry data such as traces, metrics, and logs. In the context of .NET, it is a cross-platform, vendor-neutral solution integrated into .NET applications to monitor and diagnose performance and health. OpenTelemetry in .NET includes: 1. Tracing: Tracks the flow of requests across services and components (e.g., distributed tracing). 2. Metrics: Captures performance and runtime statistics (e.g., request count, CPU usage, latency). 3. Logging: Provides structured logs for debugging and audit purposes (being standardized as part of the framework). Let's start!
What is OpenTelemetry?
Think of OpenTelemetry as the "Google Maps" for your application's internal operations.
It helps you see what's happening under the hood of your software - how requests travel between different parts of your system, how long things take, and if something is breaking along the way.
When you're building an app, especially one made up of many pieces (like microservices or cloud-based systems), it can be hard to figure out:
- Where things are slowing down.
- What's causing errors.
- How all the different parts of your app are working together.
OpenTelemetry provides tools to capture this information - traces, metrics, and logs - so you can better understand and optimize your application.
Real-World Example: A Pizza Delivery System
Imagine you're managing a pizza delivery service with multiple departments: 1. Call Center: Takes orders. 2. Kitchen: Prepares the pizzas. 3. Delivery: Delivers the pizzas.
Now, a customer complains that their pizza arrived 30 minutes late. Without any tracking system, you’re left guessing: Did the call center take too long to pass the order to the kitchen? Did the kitchen delay baking the pizza? Did the delivery driver get stuck?
If you had a system like OpenTelemetry:
Traces: You could track the journey of the order, from the call center to the kitchen to delivery, and see where it slowed down.
Metrics: You’d have data showing how long each step typically takes (e.g., baking a pizza takes 15 minutes on average).
Logs: If the delivery driver’s car broke down, there would be a log entry saying so.
 Let's take a look on the implementation.
Add NuGet Packages
The first NuGet package we need to install is OpenTelemetry.Extensions.Hosting.
dotnet add package OpenTelemetry.Extensions.Hosting
Another we need is OpenTelemetry.Exporter.OpenTelemetryProtocol
dotnet add package OpenTelemetry.Exporter.OpenTelemetryProtocol
For ASP. NET support, I'm going to add OpenTelemetry.Instrumentation.AspNetCore.
dotnet add package OpenTelemetry.Instrumentation.AspNetCore
We also need an instrumentation for Http Client, so I'm going to add one more package: OpenTelemetry.Instrumentation.Http.
dotnet add package OpenTelemetry.Instrumentation.Http
Configuration
The code below configures OpenTelemetry for: 1. Metrics: Collects performance-related statistics (e.g., request durations, memory usage). 2. Tracing: Tracks the flow of user requests through the application and other systems (distributed tracing). 3. Logging: Captures structured logs and sends them to an exporter. The configuration uses an OTLP (OpenTelemetry Protocol) Exporter to send the collected telemetry data to a backend (e.g., Jaeger, Prometheus, or any OpenTelemetry-compatible system).
builder.Services.AddOpenTelemetry() .ConfigureResource(resource => resource.AddService("NewsletterApi")) .WithMetrics(metric => { metric.AddAspNetCoreInstrumentation() .AddHttpClientInstrumentation(); metric.AddOtlpExporter(); }) .WithTracing(tracing => { tracing.AddAspNetCoreInstrumentation() .AddHttpClientInstrumentation(); tracing.AddOtlpExporter(); }); builder.Logging.AddOpenTelemetry(logging => logging.AddOtlpExporter());
Code Breakdown
- builder.Services.AddOpenTelemetry() This initializes OpenTelemetry in the application and allows configuration for resource, metrics, and tracing.
- Configure Resource - What it does: Configures the resource metadata that describes the application being monitored. - AddService("NewsletterApi"): Specifies the name of the service being monitored, in this case, "NewsletterApi." This name will appear in your telemetry backend, helping you identify which service the telemetry data belongs to.
- Metrics Configuration
- Purpose: Configures the collection and export of metrics.
- Components:
- AddAspNetCoreInstrumentation(): Automatically collects metrics related to ASP.NET Core requests, such as request durations, response codes, and incoming request counts.
- AddHttpClientInstrumentation(): Tracks metrics for outgoing HTTP calls made using HttpClient, like the number of requests and their response times.
- AddOtlpExporter(): Exports metrics data using the OpenTelemetry Protocol (OTLP) to a telemetry backend.
- Tracing Configuration
- Purpose: Configures the collection and export of traces.
- Components:
- AddAspNetCoreInstrumentation(): Automatically captures traces for incoming requests in the ASP.NET Core pipeline. This includes details like request paths, response codes, and request durations.
- AddHttpClientInstrumentation(): Captures traces for outgoing HTTP requests made using HttpClient, including the target URL and response status.
- AddOtlpExporter(): Exports traces data to a backend using OTLP.
- Logging Configuration
- What it does: Configures OpenTelemetry for structured logging.
- Components:
- AddOtlpExporter(): Exports logs to an OTLP-compatible backend. The logs will include metadata like severity levels, timestamps, and any structured fields you add.
How It All Works Together
- Resource: Identifies the service generating the telemetry data.
- Example: The service is called NewsletterApi.
- Metrics:
- Collects data like how many requests your API is handling, how long they take, and the performance of outgoing HTTP calls.
- Sends this data to a telemetry backend (e.g., Prometheus, Azure Monitor).
- Tracing:
- Captures the flow of each user request through the application and outgoing dependencies.
- Helps identify bottlenecks or errors in distributed systems.
- Sends the trace data to a backend (e.g., Jaeger, Zipkin).
- Logging:
- Sends application logs to a telemetry backend, integrating them with traces and metrics for a complete observability story.
Example Workflow
A user makes a request to your NewsletterApi. - Tracing captures the flow of the request (e.g., API received the request → validated input → called an external email service). - Metrics record how long the request took and how many requests the API has handled so far. - Logs capture structured messages about what happened during the request (e.g., "User subscribed to newsletter"). All this data is sent to a telemetry backend (via OTLP), where you can view, analyze, and troubleshoot.
How to consume Telemetry Data?
Consuming telemetry data involves collecting, storing, analyzing, and visualizing data to gain actionable insights into your application's performance and behavior.
We need to choose a Telemetry Backend.
Telemetry backends are tools that aggregate, store, and analyze telemetry data. Some popular options:
Traces:
- Jaeger
- Zipkin
- Honeycomb
Metrics:
- Prometheus
- Azure Monitor
- AWS CloudWatch
Logs:
- Elastic Stack (ELK)
- Splunk
- Fluentd
However, here I'm going to show you why Aspire Dashboard can be useful. The Aspire Dashboard is a web-based tool for monitoring and managing distributed applications, particularly in the .NET ecosystem. It integrates with OpenTelemetry to visualize telemetry data like traces, metrics, and logs, offering insights into application performance and health. Developers can use it to view real-time logs, analyze resource usage, and debug issues effectively. Its seamless integration with OpenTelemetry ensures a unified observability experience across distributed systems. Let's make it to work!
Adding Aspire Dashboard
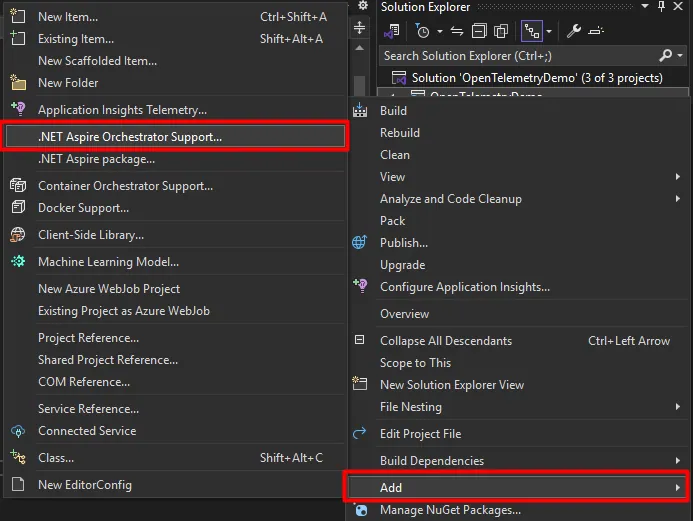
You can literally add an Aspire Dashboard in 1 click. You need to select .NET Aspire Orchestrator Support from the Add menu. This will add 2 new projects to your Solution:
- OpenTelemetryDemo.AppHost
- OpenTelemetryDemo.ServiceDefaults
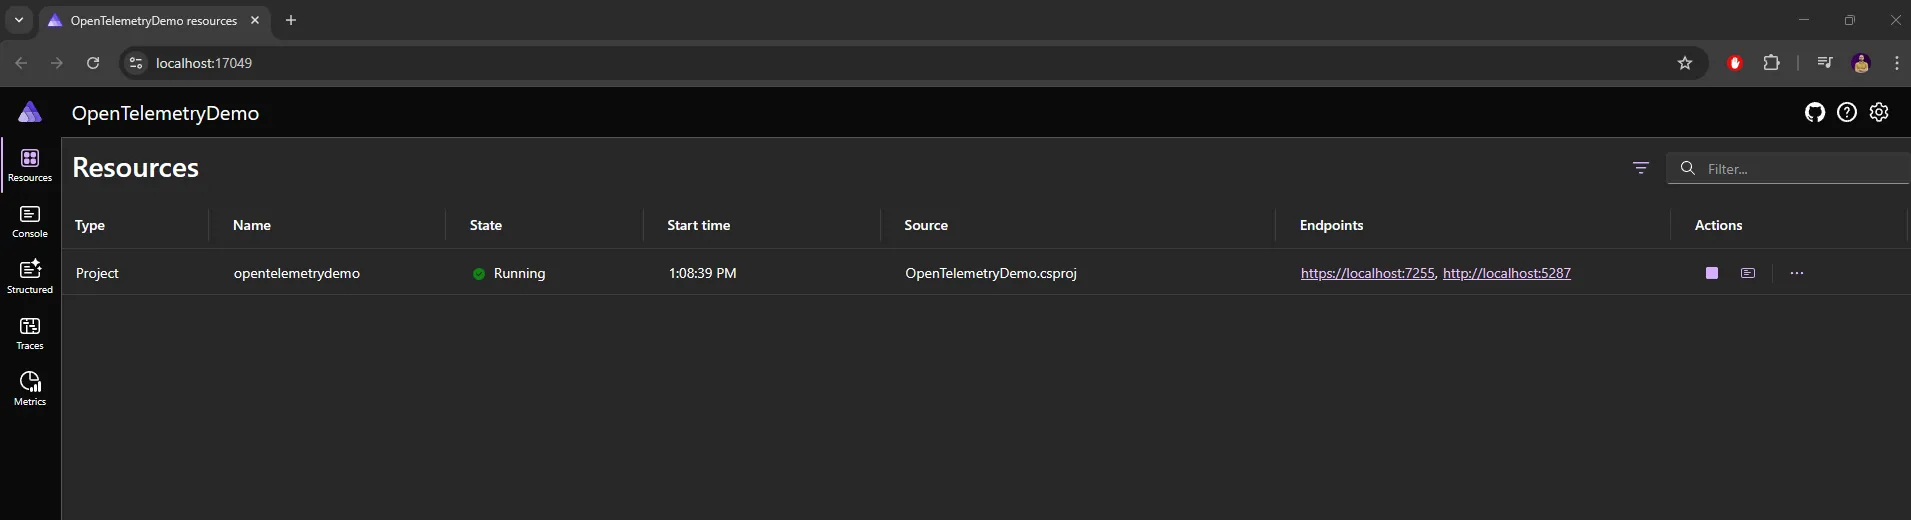
 You can run AppHost and get a beautiful dashboard with various details.
Now we need to setup that our Otlp Exporter is a new created Aspire Dashborad - where we will see all the necessary details. We need to add an endpoint to .AddOtlpExported method that points to the Aspire Dashboard:
.AddOtlpExporter(options =>{ options.Endpoint = new Uri("https://localhost:17049");});
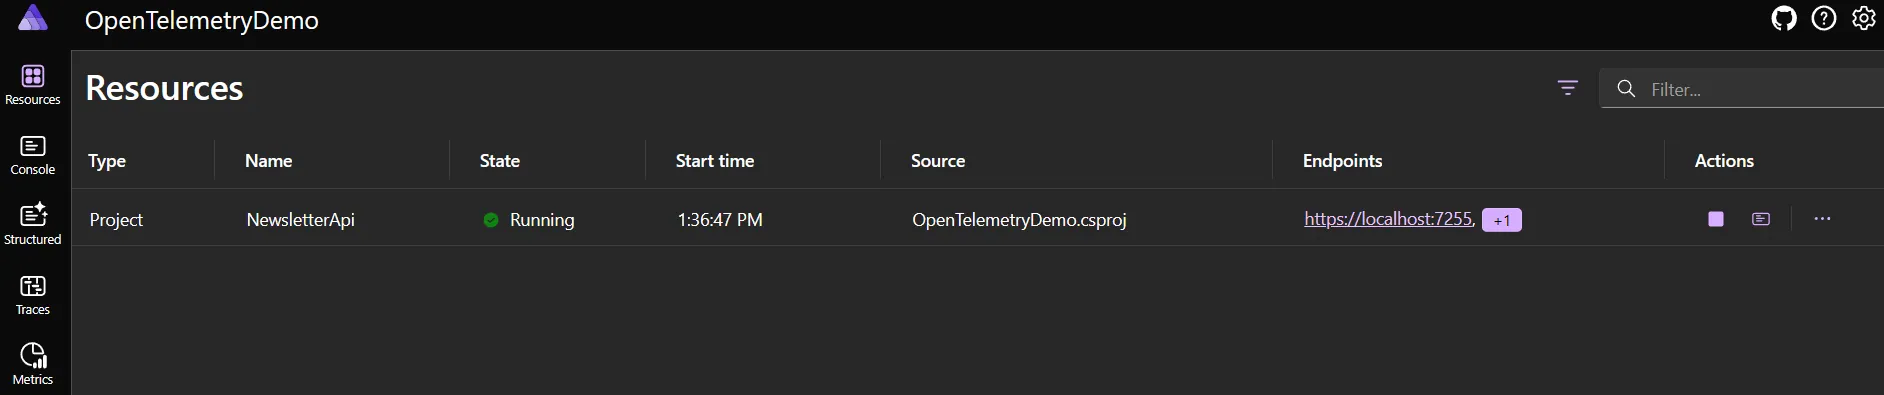
Let's start the application (AppHost starts). The Aspire Dashboard will open as shown above, but we will have details for our resource - NewsletterApi.
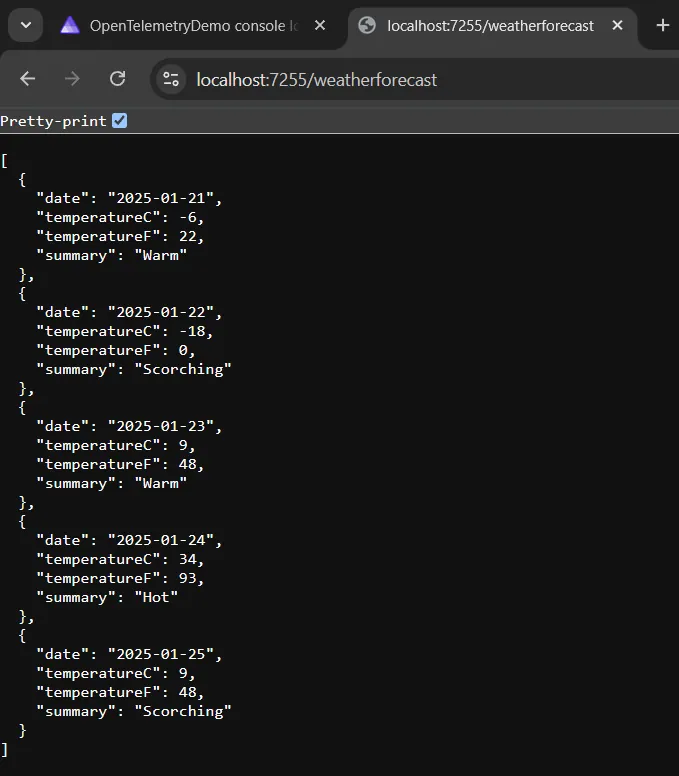
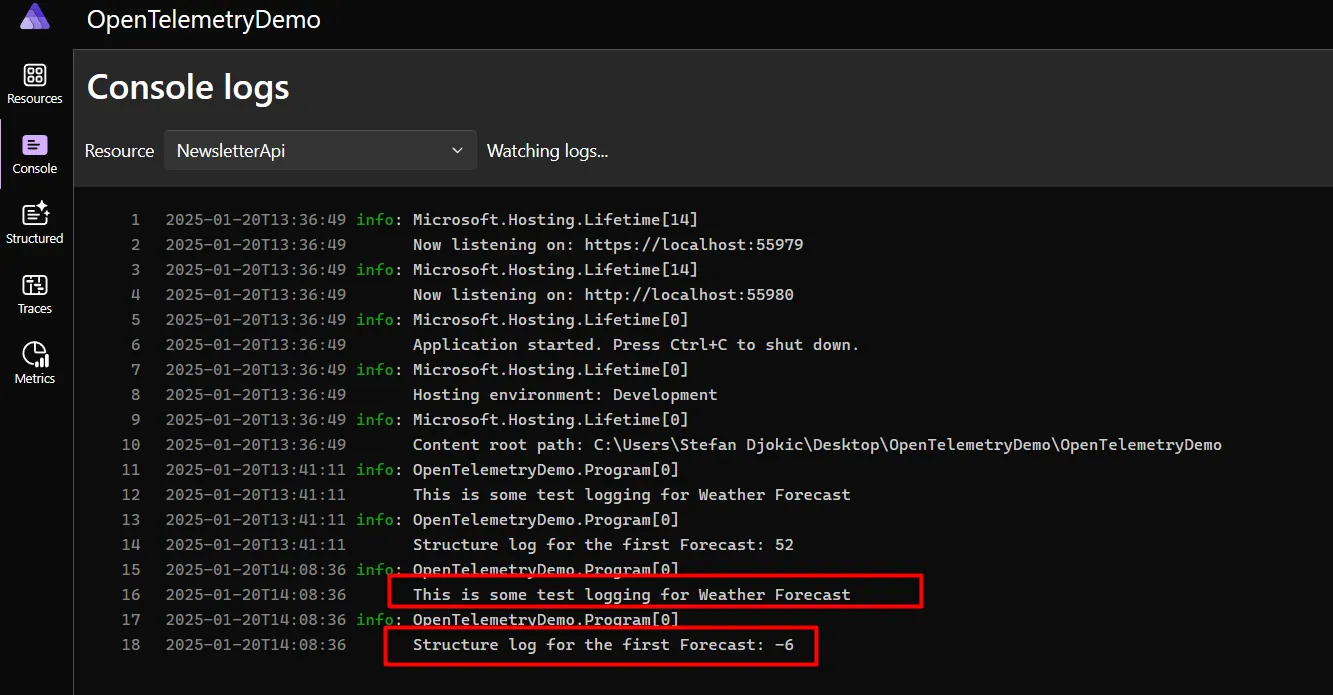
 I will call the endpoint by default in MinimalAPIs to get the current weather forecast. Within this endpoint, I set it to log some details.
 As we can see below in the image, AspireDashboard receives and reads logs from our application.
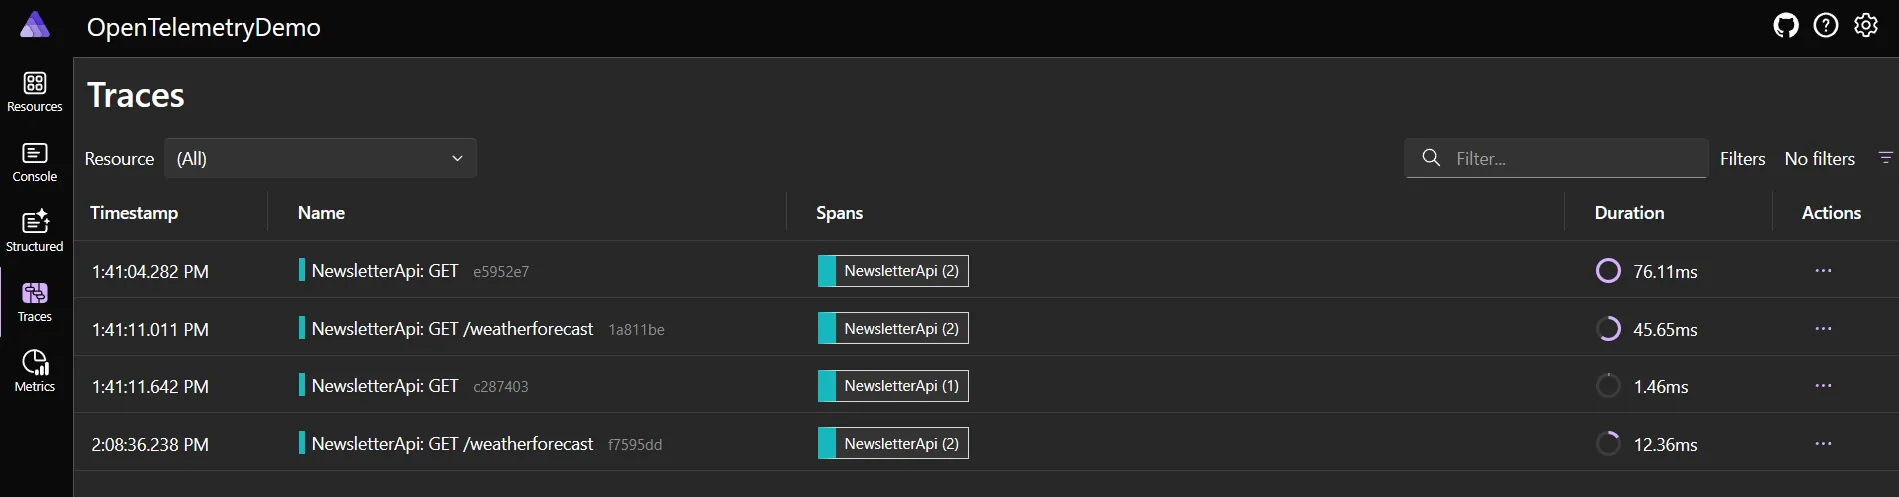
 We can also see Traces, where every request that happens in the application is tracked and contains a lot of information about the request itself.
The situation is similar for metrics.
We can also see Traces, where every request that happens in the application is tracked and contains a lot of information about the request itself.
The situation is similar for metrics.
For complementary observability practices, check out Structured Logging with Serilog and Health Checks in .NET 8.
Wrapping Up
OpenTelemetry is a powerful, open-source observability framework for collecting traces, metrics, and logs. It provides a unified, vendor-neutral standard, making it easier to monitor distributed systems, debug issues, and optimize performance. With OpenTelemetry, you can track request flows, monitor application health, and log effectively while staying vendor agnostic. Its seamless integration with .NET frameworks like ASP.NET Core makes it an excellent choice for modern, cloud-native applications.
In summary, OpenTelemetry empowers developers to build reliable, high-performance systems with deep insights and operational excellence.
The complete code written in .NET 9 can be found in the following repository.
That's all from me today.
P.S. Follow me on YouTube.